Summary
It is sometimes suggested that since the severity of many kinds of moral catastrophes (e.g. wars and natural disasters) fall along a power-law distribution, efforts to reduce suffering should focus on “a few rare scenarios where things go very wrong”. While this argument appears quite plausible on its face, it is in fact a lot less obvious than it seems at first sight. Specifically, a fat-tailed distribution need not imply that a single or even a few sources of suffering account for most future suffering in expectation, let alone that we should mostly prioritize a single or a few sources of suffering.
Introduction
In his post Is most expected suffering due to worst-case outcomes?, Tobias Baumann explores how skewed the distribution of future sources of suffering might be. His conclusion, in short, is that worst-case outcomes may well dominate, but that it is unclear to what degree we should expect future suffering to be concentrated in worst-case outcomes.
My aim in this post is not to shed further light on this matter. Instead, my aim is to clarify some key points concerning what follows and doesn’t follow if we do assume that future (expected) suffering conforms to a highly fat-tailed distribution. In addition, I will outline some reasons to give considerable weight to a broad approach to s-risk reduction as opposed to focusing on a few narrow risks.
Observed distributions
Perhaps the best place to start is to look at a couple of real-world examples of fat-tailed distributions.
First, consider income distribution in the US in 2019:
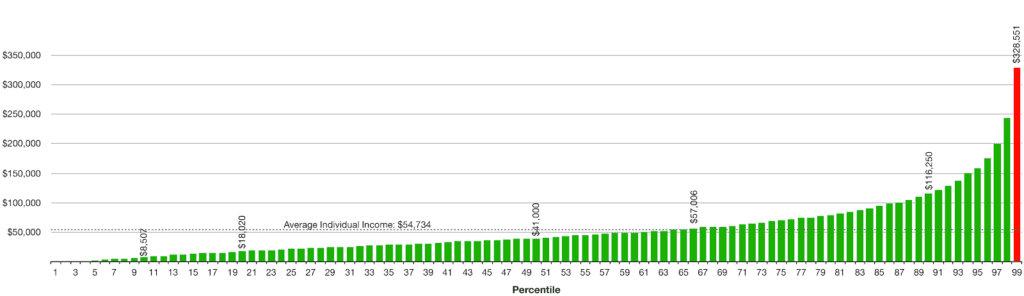
This is a fat-tailed distribution, with the top one percent of earners (the red bar) making far more than the rest. Still, the income of the richest one percent is “only” about six percent of the total income. The one percent are far richer than the rest, but their income is nowhere near accounting for 50 percent of total income. Top seven percent of earners make 25 percent of the wealth, while the top 20 percent earn roughly 50 percent of the total income.
Another example with a significantly heavier tail is wealth distribution in the United States: in 2007, the top one percent possessed 35 percent of the total wealth, the next four percent owned 27 percent, while the bottom 60 percent had less than five percent of total US wealth.
Implication: Less priority to the low-end
What would be the upshot if future sources of (expected) suffering followed any of these distributions?
Perhaps the most obvious implication is found, not at the crowded end, but rather toward the bottom of the distribution. For example, in the first two distributions above, almost negligibly little wealth is found among those who have the least. So if one were to tax people efficiently, it would make sense to largely ignore the bottom 20 percent of the income distribution, and the bottom 60 percent of the wealth distribution. Sure, there would still be some wealth to gain there, but if we had severely limited resources, the effort would hardly be worth it.
Likewise, in terms of our analogy to future sources of suffering, it would make sense to pay less attention to the sources of suffering — or future scenarios, if we conceptualize in these terms — that contain relatively little suffering in expectation, as there is comparatively little suffering to reduce there.
Yet note that there is a long way from this conclusion to the claim that we should focus almost exclusively on a small space of possible scenarios or sources of suffering at the other end of the distribution.
Fat tails can still be wide
As the examples above show, the fact that a distribution is fat-tailed does not necessarily imply that a bulk of the distribution is found in a tiny sliver. For instance, in the case of the US income distribution, one would have to include the top 20 percent of earners in order to cover 50 percent of the total income — a much broader range than just the top one percent.
Even in the heavily skewed case of wealth inequality, we would still need to go markedly beyond the top one percent of earners in order to cover 50 percent, and we must go beyond the top ten percent if we are to cover three quarters of the total wealth.
Moreover, the top one percent of a distribution like this is usually rather diverse, which leads us to the next point.
The top one percent is not a narrow set
Even if we grant that potential sources of future suffering follow a power-law distribution similar to wealth distribution in the US — and we should remember that it is quite uncertain whether it does — it does not follow that “most of the expected suffering comes from a few rare scenarios where things go very wrong”.
As a case in point, the wealthiest one percent in the US is a diverse group of people, at least in terms of how they acquired their wealth (e.g. from many different industries), and they are also a rather large group in absolute terms (one percent of the US population is still more than three million people). Similarly, the worst one percent of scenarios or sources of future suffering could be a rather diverse set, with a substantial number of different sources of suffering.
To illustrate this point, consider a real-world example that is even more extreme than any of those we have seen above, namely the frequency of words. It is a commonly observed pattern that words fall along a very fat-tailed distribution, conforming to what is known as Zipf’s law. For instance, in the Brown Corpus of American English text, the most frequent word (“the”) accounts for around seven percent of all words, while the second most frequent word (“of”) accounts for 3.5 percent. Only 135 words — 0.27 percent — account for half of the words.
And yet 135 is still a good deal more than “a few”. Indeed, focusing on preventing 135 different sources of suffering (e.g. different types of agential and incidental s-risks) hardly qualifies as a particularly narrow focus in an absolute sense, although it sure is quite narrow in a relative sense, when compared to the entire space of possible sources of suffering. We should thus be careful not to confuse such relative narrowness with absolute narrowness. The absolute claim that we should focus on a few specific scenarios is far stronger and much less warranted than a relative claim of the sort that we should focus on, say, the top three percent.
A broad focus may still be ideal given fat tails
A fat-tailed distribution of future sources of suffering does not necessarily imply that we should focus exclusively, or even primarily, on a small class of worst-case outcomes, such as the top three percent. It could well be that we can reduce more suffering by focusing on a much broader scope.
The figures below illustrate this point:
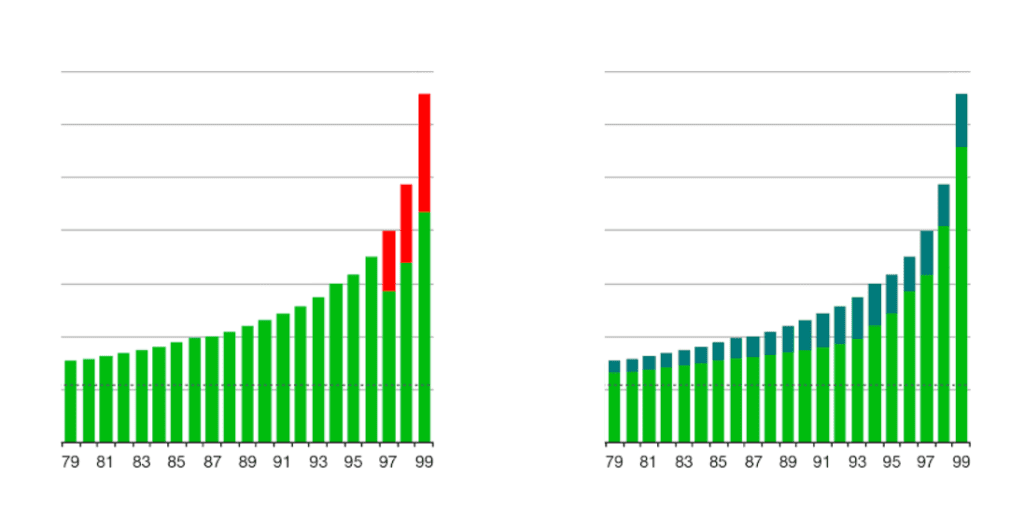
The figure on the left illustrates our impact given a strategy where we devote all our marginal resources toward reducing the sources of suffering found in the upper three percentiles (which is still a rather broad class), while the figure on the right illustrates our impact given a strategy where we target many different sources of suffering. The red and blue colorings represent expected suffering reduced, with the broad strategy on the right reducing significantly more suffering in expectation, even as it is less effective among the very top percentiles. (The impact on both figures is exaggerated for illustrative purposes; realistically, we should not assume that our marginal actions will have this much of an effect on expected global outcomes.)
My point here is not that the broad strategy in fact does reduce the most suffering, but simply that it may do so, and hence that even a very fat-tailed distribution does not by itself imply that we should pursue the narrow strategy on the left over the broader one on the right.
After all, it could be the case that there are common actions we can take that help reduce suffering from a broad range of sources (such as by increasing the willingness and resources devoted toward their reduction), and there might likewise be low-hanging fruit to reap in each of the respective classes of causes and interventions.
Note that movement building plausibly accomplishes both: it potentially targets many different sources of suffering (indirectly), and may enable us to pick low-hanging fruit with respect to many different sources of future suffering —not to mention that it can help us gain greater clarity of the risk landscape, which leads us to another set of reasons to favor a broad approach.
Epistemic reasons to favor a broad approach
The fact that we have a lot of uncertainty about the distribution of future sources of suffering is an additional reason to favor a broader, more robust approach. For not only can movement building and broad research on prioritization give us a better sense of the general shape of the distribution of future suffering, it should also help us get a better sense of which exact sources of suffering that are most worrisome, as well as how we can best target those sources of suffering. The greater our uncertainty is on these matters, the greater is the risk that our favored priorities and interventions are misguided, and the more important it is that we get more people to help us update our views.
A very narrow focus is especially risky given vast uncertainty, since there is then a greater probability that we are spending most of our resources on something that is suboptimal. Inspired by the illustrations above, we may think of it as drawing among a hundred different tickets, aiming to draw the single longest one based on our best knowledge. And if our “best knowledge” relies strongly on speculation, the probability that the ticket we draw is not in fact the longest one will be quite large. It is, after all, quite possible that the very worst sources of future suffering are not among those we currently consider most worrisome — they could be among those that we currently give little weight, or indeed be unknown unknowns.
Note that the epistemic reasons in favor of a broad approach listed here are quite independent of the reasons listed in the previous section — i.e. the fact that we may take actions that have a positive influence on many different sources of suffering, e.g. movement building, and the fact that we may pick low-hanging fruit in the prevention of many different risks. (Those points would apply even if we knew which sources of suffering are most worrisome.) In combination, these distinct reasons provide a rather strong case for giving at least considerable weight to a broad and robust approach to reducing s-risks.
Beware biases
The tension between narrow and broad approaches underscores the importance of being aware of the biases that might influence our assessments of these matters. These include our tendency toward narrow framing in general, and belief digitization in particular: our inclination to focus purely on the single hypothesis we consider most plausible, and to give insufficient weight to hypotheses we consider less likely. This bias plausibly pulls us toward a narrow approach.
Beyond that, the fact that our brains did not evolve to consider complicated and uncertain questions concerning global prioritization renders it plausible that we generally underestimate the extent of our uncertainty on such matters (Vinding, 2020, sec. 9.2). In contrast, we seem to have little reason to think that we err to a similar degree in the opposite direction, toward overemphasizing our uncertainty. Indeed, we are generally prone to overconfidence bias, which is an additional reason to expect us to underestimate the extent of our uncertainty, and to be overly confident about our current priorities.